An infographic series about tourism in The United States.
In this series, you can find conceptual and outrageous ideas and typography that are outside the box.
Data Visualization using Javascript and Power Bi.
An illustration for a baby product.
A style guide for the community platform that I built.
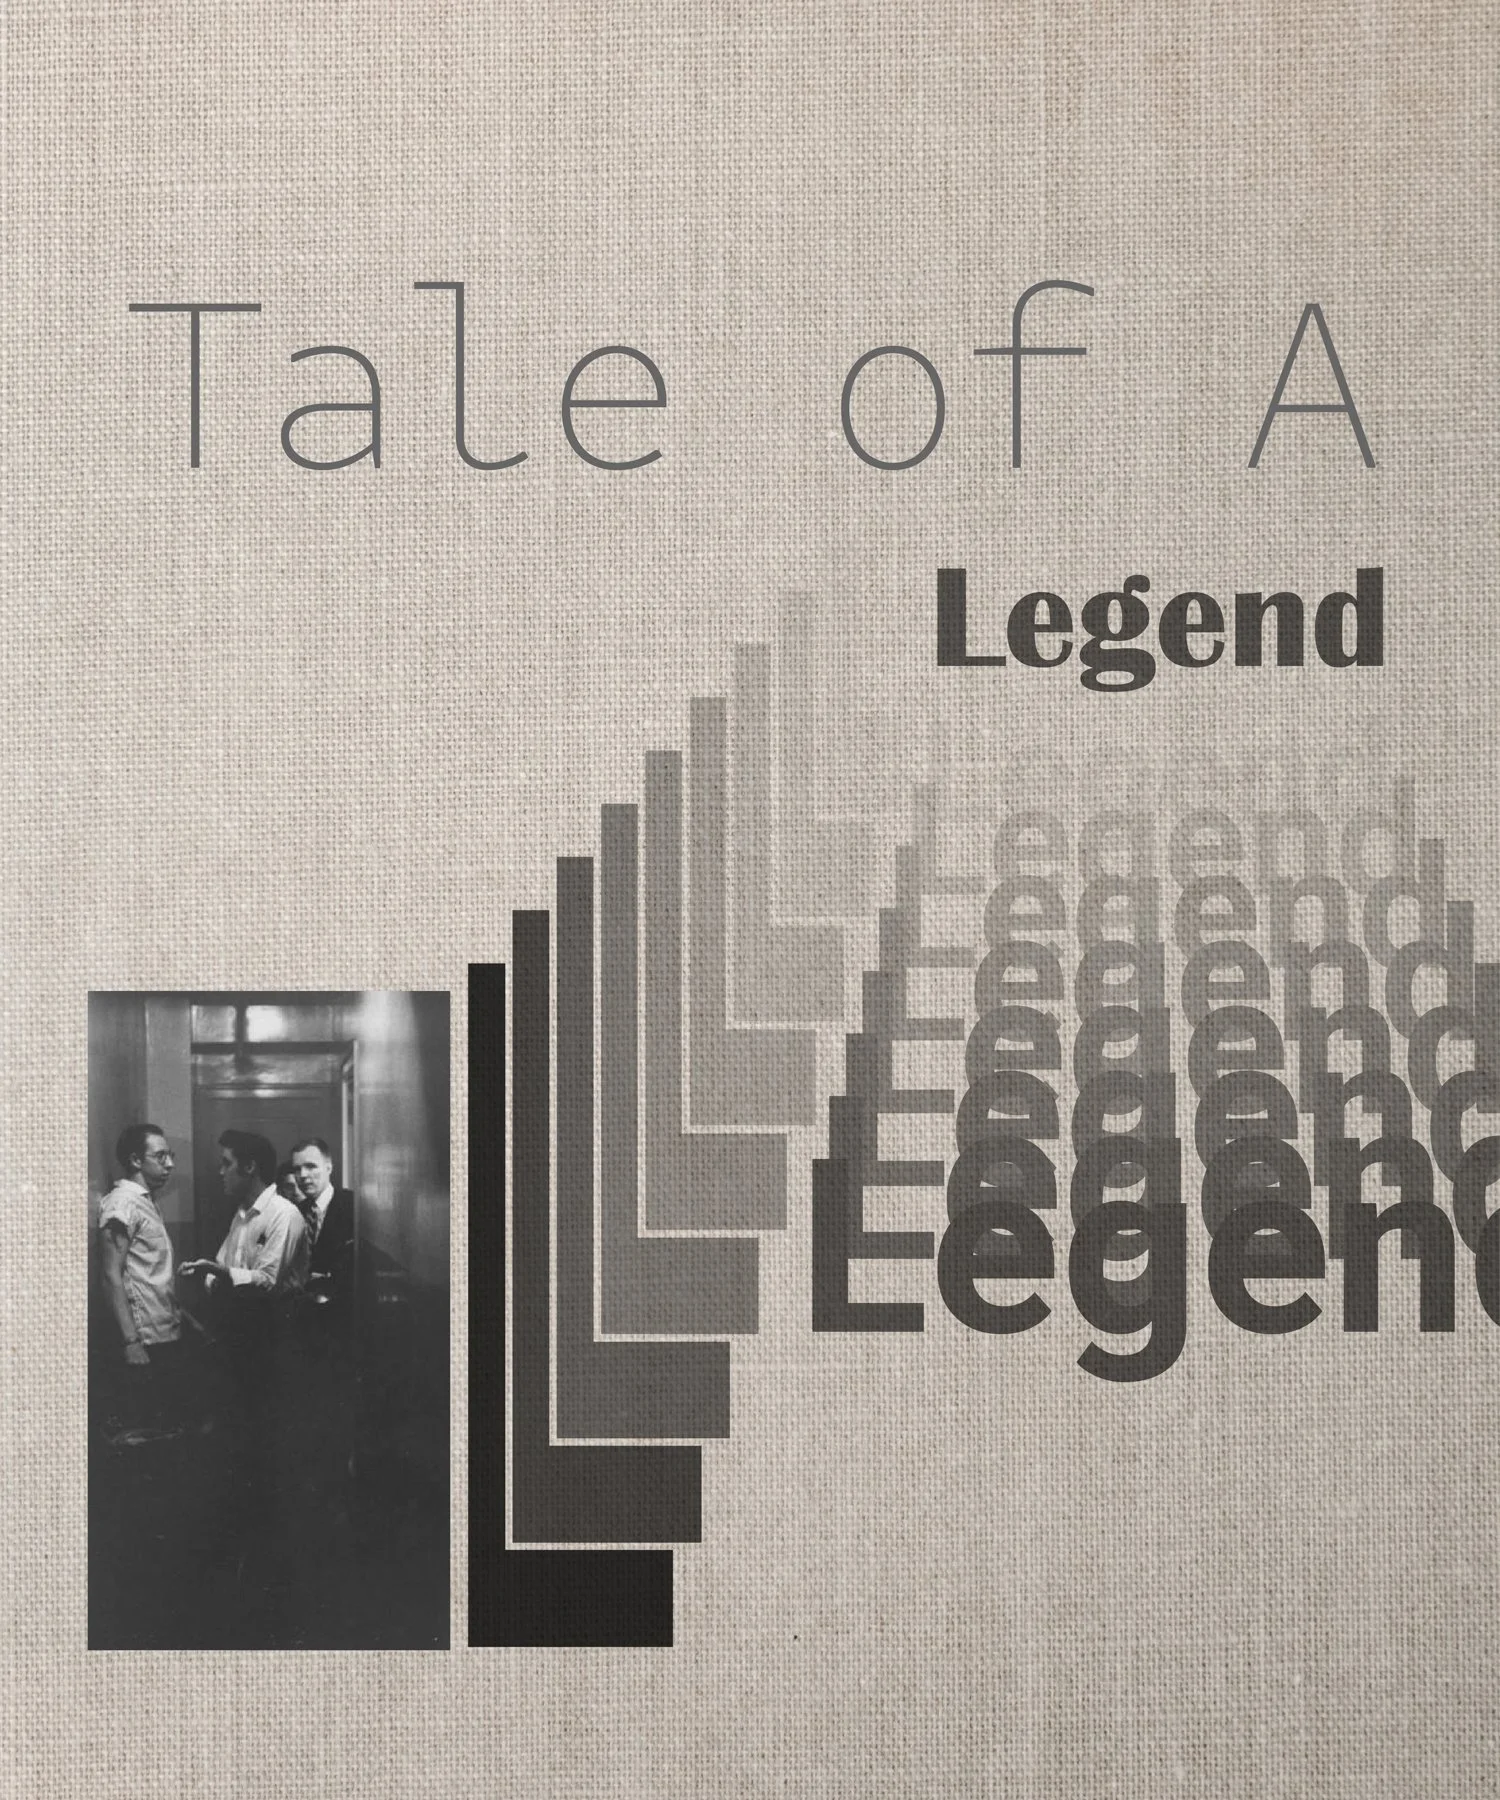
A series of posters using typography and visual elements to interpret the truth in life.
A typography series to capture the nuance of them.